To recognize whether an asset has peaked or bottomed out, traders use technical indicators such as mathematical computations or even something as basic as a trendline. It forecasts the direction of the financial market by using historical price, volume, and open interest data.
In order to find trading opportunities, traders use this fundamental information. Technical trading indicators are widely used by investors and traders to find high-probability entry and exit opportunities in trades.
Most trading systems provide hundreds of indicators, so it’s simple to utilize too many or employ them inefficiently. These technical analysis tools will be explained in detail in this article so that you may choose the right ones for your needs while also avoiding information overload.

Trading charts are a trader’s window into the markets. Fast deciphering and quick responses may be made possible by easy-to-to-read market charts (including market charts, news feeds, order entry windows, and so on) that can increase a trader’s situational awareness.
Read Also:
It should be said that at first when financial trading indicators were newly developed in the financial markets, they weren’t quite popular.
Because of that, for example, in FX trading, those brokers that had trading platforms with financial trading indicators started to use several incentives, like Forex deposit bonuses, in order to lure more beginner and professional traders.
Nowadays, financial trading indicators have become more sophisticated and popular than they were in the past. For the most part, trading platforms provide for a considerable deal of customizability when it comes to chart colors and designs, including background colors, moving average styles and colors, as well as chart text’s size, color, and font.
Traders can employ indicators more efficiently if their charts and workspaces are well-organized and aesthetically attractive. So what are the best financial trading indicators that won’t clutter your chart?
Contents
Fibonacci Retracement Indicator
For those who believe in Fibonacci, the reasoning goes something like this: If nature and the universe are made up of these Fibonacci ratios, shouldn’t the same be true of financial markets? When learning to trade Fibonacci retracements, analysts may make use of this strategy.
We may imagine that after a market’s increase, it doesn’t travel in a straight line and begins to decline. Traders will use Fibonacci ratios to determine where the market’s decline will come to an end, and the rise will restart.
When used correctly, Fibonacci retracement levels may accurately identify the moment at which a retracement is about to reverse direction. There is a lot of strength in using retracement levels, whether you’re day trading or investing for the long run.
The Elliott Wave theory, a technical analysis method used to detect market cycles, relies heavily on Fibonacci numbers as well. When it comes to asset classes, the tool may be used for anything from forex to stocks to commodities and everything in between.
When you divide the vertical distance between the high and low points by the important Fibonacci ratios, you get Fibonacci retracement lines. The 23.6%, 38.2%, and 61.8% retracement levels are shown on the trading chart with horizontal lines.
The 50 percent-to-total-assets-under-management ratio is also popular among traders. Even while this isn’t a true Fibonacci ratio, it’s nevertheless beneficial in certain situations. Before resuming its initial direction, security would often retrace by roughly 50%.
Parabolic SAR Indicator
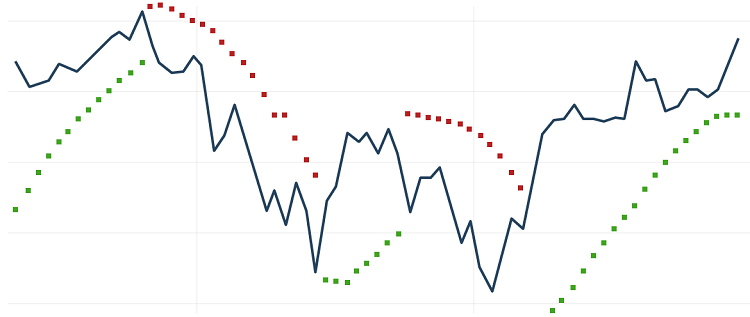
Traders utilize J. Wells Wilder’s Parabolic SAR indicator to detect trend direction and price reversals. A technique called “SAR” or stop and reverse is used by the indicator to find the good exit and entrance positions. Parabolic stop and reverse (PSAR) is another name for the indication.
An asset’s price movement might cause the parabolic SAR indicator to appear above or below its price on a chart. For upward trends, a dot is put below the price; for downward trends, a dot is placed above the price.
When the dots travel from one side of the asset’s price to the other, the parabolic indicator produces buy or sell recommendations. Buy signals are generated, for example, when dots move from above to below the price, whereas sell signals are generated, for example, when the dots move from below to above.
Regardless of price changes, the PSAR moves. This implies that even if the price falls sideways after first increasing, the PSAR will continue to rise. Even if the price does not fall, a reversal signal will be created. A reversal signal is generated when the PSAR catches up to the price.
When the parabolic indicator crosses over to the other side of an asset’s price, it provides a new signal. As a result, active traders value the indicator’s ability to guarantee a market position at all times.
Read Also:
- Electric Company
- Walmart Unveils Low Price Insulin
- Which Luxury Brand Shares Its Name With The French Explorer Who is Credited With Naming Canada?
Traders may make the greatest money with this indicator in markets that are trending since huge price changes enable them to make significant profits. Whenever a security’s price is range-bound, the indicator will keep reversing, resulting in many trades with modest profit or losses.
With the parabolic indicator, traders may determine if a market is trending or not by combining it with other technical indicators like the average directional index (ADX), the moving average (MA), and trendlines.